Metrics
Monitor your application performance with real-time and historical metrics through Grafana dashboards.
Accessing Metrics
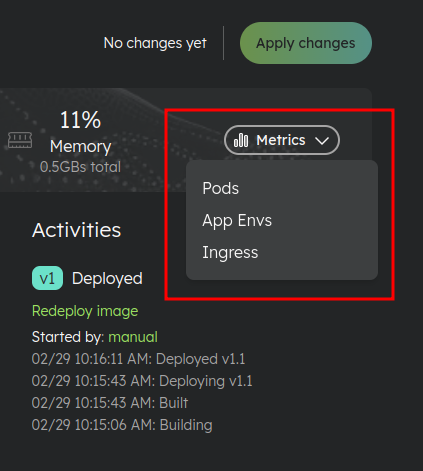
You can access your application metrics via Grafana dashboards from the App Env page header in the Metrics dropdown.
Available Dashboards
The available dashboards vary depending on the environment type.
For Applications
- Pods: Container-level metrics for each pod
- App Envs: Application environment metrics including memory, CPU, and network usage
- Ingress: Traffic and request metrics for incoming connections
For Services (Databases, Cache, etc.)
- Pods: Container-level metrics for each pod
- App Envs: Service environment metrics including memory, CPU, and network usage
- Dedicated Dashboard: Some services have a dedicated dashboard with service-specific metrics (e.g., database connections, query performance)
Dashboard Metrics
The dashboards provide detailed metrics including:
- Memory Usage: Monitor memory consumption to ensure your application has adequate resources
- CPU Usage: Track CPU utilization across your containers
- Network Traffic: View incoming and outgoing data
API Access
You can also access metrics programmatically via the Public API or MCP tools.